What a dyno measures and how to read the results
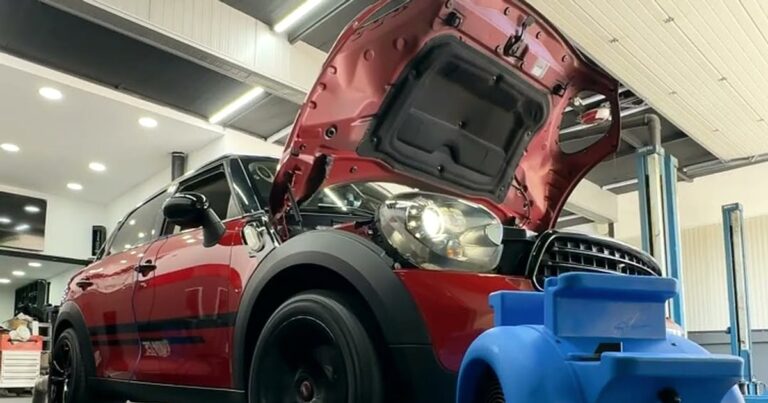
When a vehicle goes on the dyno, the number most people look at first is peak power. However, the question of what a dyno measures needs a more precise answer: in automotive use it primarily records force and resistance at the driven wheels, and power and torque are calculated from that data. That's why a quality dyno test isn't just “one number” – it's a controlled measurement of how the whole drivetrain behaves.
For the owner of a car, motorcycle or work machine, the value of a dyno isn't in a spectacular peak on the chart. Its real value is that it shows where the engine actually makes power, how it delivers torque and whether changes to the ECU, TCU, intake, exhaust or turbo give a result that can be repeated.
What does a dyno measure on a vehicle?
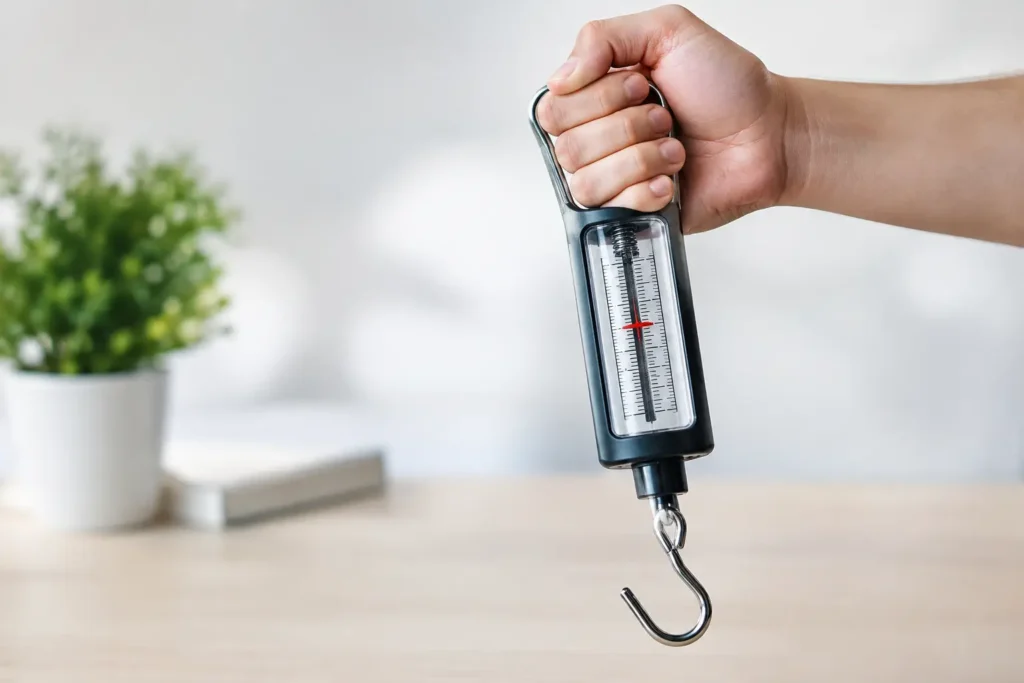
In the broader technical sense, a dynamometer is an instrument for measuring force or torque. There are handheld dynamometers, laboratory devices and industrial systems that can measure pulling or tensile force. In the automotive industry, a dyno test usually means a chassis dyno with rollers.
The vehicle is placed on the rollers, the driven wheels turn them, and the system tracks the rollers' acceleration and the load created by the dyno's brake. From these measurements the software determines wheel power across the rev range. Torque is then calculated relative to rotational speed.
The key difference is simple: a chassis dyno doesn't measure power directly at the engine's crankshaft. It shows what's available at the driven wheels, after losses through the gearbox, clutch or torque converter, differentials, propshaft and other drivetrain parts.
That isn't a drawback. On the contrary, for checking the real result after a vehicle calibration, wheel power is very relevant data. It shows how much the drivetrain actually puts down to the ground under test conditions.
Power, torque and the shape of the curve
Power and torque aren't the same thing, although they're often mixed up in conversation. Torque describes the twisting force the engine produces, expressed in newton-metres (Nm). Power shows how quickly the engine can do work, and is usually shown in kilowatts (kW) or horsepower (HP).
That's why a dyno chart is worth more than the peak figure alone. The torque curve shows where the vehicle pulls strongly, how early the turbo builds useful boost and whether delivery stays stable up to higher revs. The power curve reveals how well the engine keeps its ability to accelerate as revs rise.
Two vehicles can have similar peak power but a completely different feel on the road. An engine with a flatter, wider torque plateau can be more convincing in in-gear acceleration than one that reaches its peak only in a narrow rev band. For diesel vehicles, work machines and vehicles that tow, that torque spread is often more important than peak power.
On motorcycles, response is especially sensitive. A small change in the mid-range can significantly change how the engine drives out of a corner or responds as the throttle opens. That's why measurement on a dedicated hub dyno isn't used just to confirm the peak, but also for precise tuning of power delivery.
Why aren't all dyno results directly comparable?
A result from one dyno shouldn't automatically be compared with a result from another unit, on a different day or in a different measurement mode. A difference doesn't necessarily mean one result is wrong. Test conditions and methodology have a real effect on what's shown.
Air temperature, atmospheric pressure and humidity affect the density of the intake air. A turbo engine can compensate for part of the difference, but not completely and not in every operating range. Cooling efficiency is also crucial, especially for vehicles that get much more airflow on the road than in the workshop.
Tyre pressure, tyre temperature, fuel type, the selected gear, oil and coolant temperature, and the way the vehicle is strapped to the rollers also matter. On automatics and all-wheel-drive vehicles, gearbox logic, drive distribution and electronic stability systems play an additional role.
That's why the most useful comparison is before and after, done on the same dyno, with the same vehicle and conditions as similar as possible. Then the chart clearly shows the change brought by the calibration or mechanical work, without guesswork based on figures from different sources.
Roller dyno and hub measurement
A roller dyno measures performance through the contact between tyre and roller. Its advantage is that it tests the vehicle in a configuration close to real driving: through the wheels, tyres and the complete drivetrain. An AWD system is especially important for all-wheel-drive vehicles because it allows all driven wheels to be measured simultaneously and in a controlled way.
A hub dyno, often used for motorcycles, connects more directly to the drivetrain after the wheel is removed. This removes the effect of tyre slip on the roller and gives a very stable load. However, the measurement method is different, so such results also shouldn't be compared with roller dyno measurements without context.
Neither approach is universally “better”. The right choice depends on the vehicle, the purpose of the measurement and the load control needed. For AWD cars, synchronised rollers and a correctly set test mode are important. For motorcycles, a dedicated hub dyno is often an extremely precise tool for calibrating fuel, ignition and throttle response.
What does a reliable dyno measurement look like?
A reliable result starts before the first run. The vehicle must be in good technical condition, with checked oil and coolant levels, suitable tyres and no active faults that could limit power. Diagnostics are an important part of the process, because a problem with boost, fuel, a sensor or clutch slip can change the result and lead to the wrong conclusion.
During the test, the parameters that explain the chart are monitored: boost pressure, intake air temperature, lambda on petrol engines, ignition corrections, exhaust gas temperature where available, and gearbox behaviour. A number on the screen without this data gives only part of the picture.
The ECU and TCU calibration, the dyno allows a change to be checked under repeatable load. The goal isn't just to raise peak power, but to build consistent torque delivery within limits the engine, turbo, gearbox and drivetrain can reasonably handle. Especially on automatic gearboxes, proper management of torque and shift strategy can be as important as the engine map itself.
ASF Motorsport uses an advanced AWD chassis dyno and a dedicated motorcycle hub dyno for exactly this reason: precision comes from combining the right measuring system, diagnostic data and a calibration tailored to the specific vehicle. That's the approach behind the Where Speed Meets Precision philosophy.
How to read a dyno chart without drawing the wrong conclusions
First look at the revs where the engine makes its torque, not just where it peaks. Then see whether, after a change, there are sudden drops, uneven oscillations or an unexpectedly early fall-off in power. Such things can be a normal result of a gear change or protection strategies, but they can also point to the need for further diagnostics.
Also check whether the chart shows wheel power or estimated engine power. Some software uses corrections and estimated drivetrain losses to show an engine figure. That data can be useful, but it mustn't be presented as a directly measured crankshaft result.
The best dyno report links the numbers to the vehicle's real behaviour. If the vehicle responds better in the mid-range, the gearbox uses the available torque more logically and delivery stays stable over repeated runs, the measurement has done its job. The dyno is then not a trophy for social media, but a precise tool that shows where performance is really built.